(authored by @sampson)
For those impacted by performance and/or memory issues, here are a couple steps to take which will help us in helping you.
As many here have stated, it’s good to disable extensions. Extensions are third-party applications; it’s entirely possible an extension could eat up tons of memory. By removing them from the equation, we greatly simplify the task of identifying the problem itself.
Create a Testing Profile
Testing with a private window is good, but this usually leaves a normal window in the background (where performance issues could still occur). Using a fresh profile is a much better approach. To do this, select ☰ --› More tools --> Add new profile.

Your new profile will launch immediately. If you haven’t had a second profile up to this point, you will now notice a small circle image at the top-right of Brave. If you have had a second profile prior to this point, you’ll note a new, distinct image at the top-right:

This profile is fresh, meaning it shouldn’t have any extensions installed or browsing history (![]() check
check brave://extensions to make sure none have been side-loaded by other software on your computer).
Monitoring Memory and Performance
Users tend to share screenshots of memory-management tools beyond the browser, such as Task Manager. This doesn’t help much, since it doesn’t identify which processes within the browser (be they tabs, frames, extensions, service workers, etc.) are using the resources.
Brave comes with a built-in Task Manager. You can find it in ☰ --› More Tools --› Task Manager. Unlike Windows’ Task Manager, Brave’s built-in option tells you how much CPU/GPU, memory and more are tied to specific browser tabs and extensions.
Right-clicking on any column header will reveal additional types of data you can review; turn on as much as you like, or as little. Memory, Cache, CPU, and GPU are among the most helpful.

Less is More
Now that we have a new profile (make sure that the original profile is closed closed), and a way to monitor memory and performance, we can start testing. We don’t know what this point which sites are causing the most drain, or if it’s something in Brave itself. So it’s best to start simple. Visit only a couple sites, and keep an eye on that memory usage (you can click the headers to sort the process list into ascending or descending order; great way to keep the biggest memory-hogs on top).
If typical browsing activities on one site doesn’t impact memory and/or performance, open a new tab and begin testing another site. Brave’s Task Manager will continue to report memory and performance metrics for specific tabs.
If you are unable to reproduce the issue by browsing to the sites you typically visit, you can proceed to install an extension you commonly use. In similar fashion to testing pages, let’s start with only a single extension. Install (and complete any necessary setup afterwards), and keep an eye on that task manager for sudden spikes in usage.
Reporting an Issue
Think you might have found an issue? We’d love to know! Metrics from Task Manager are incredibly helpful, especially since they explicitly identify the process to which they are associated. You might just find that Brave starts to crawl after a few minutes on a popular site, or moments after installing a commonly-used extension. With that information, our team will be better equipped to move more promptly towards improving your experience.
Deleting a Testing Profile
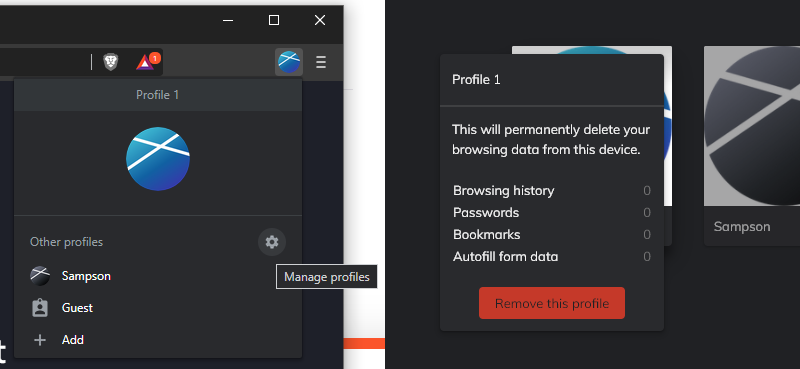
When you’re ready to delete your testing profile, click the image at the top-right of Brave and select the ![]() icon to open up the Manage Profiles view. Hover over the testing profile to reveal a ⋮ in the top-right corner—clicking that will give you the option to remove the testing profile (Note, double-check the metrics to make sure this is the profile you wish to delete).
icon to open up the Manage Profiles view. Hover over the testing profile to reveal a ⋮ in the top-right corner—clicking that will give you the option to remove the testing profile (Note, double-check the metrics to make sure this is the profile you wish to delete).