I’m using Mac App EtreCheckPro Version 6.7.3 (67033) to run diagnostics on my Macbook Pro (2.6 GHz 6-Core Intel Core i7, Intel UHD Graphics 630 1536 MB, 16 GB 2667 MHz DDR4, MacOS Ventura 13.1 (22C65)). My Brave Browser is the latest Version 1.46.144 Chromium: 108.0.5359.128 (Official Build) (x86_64).
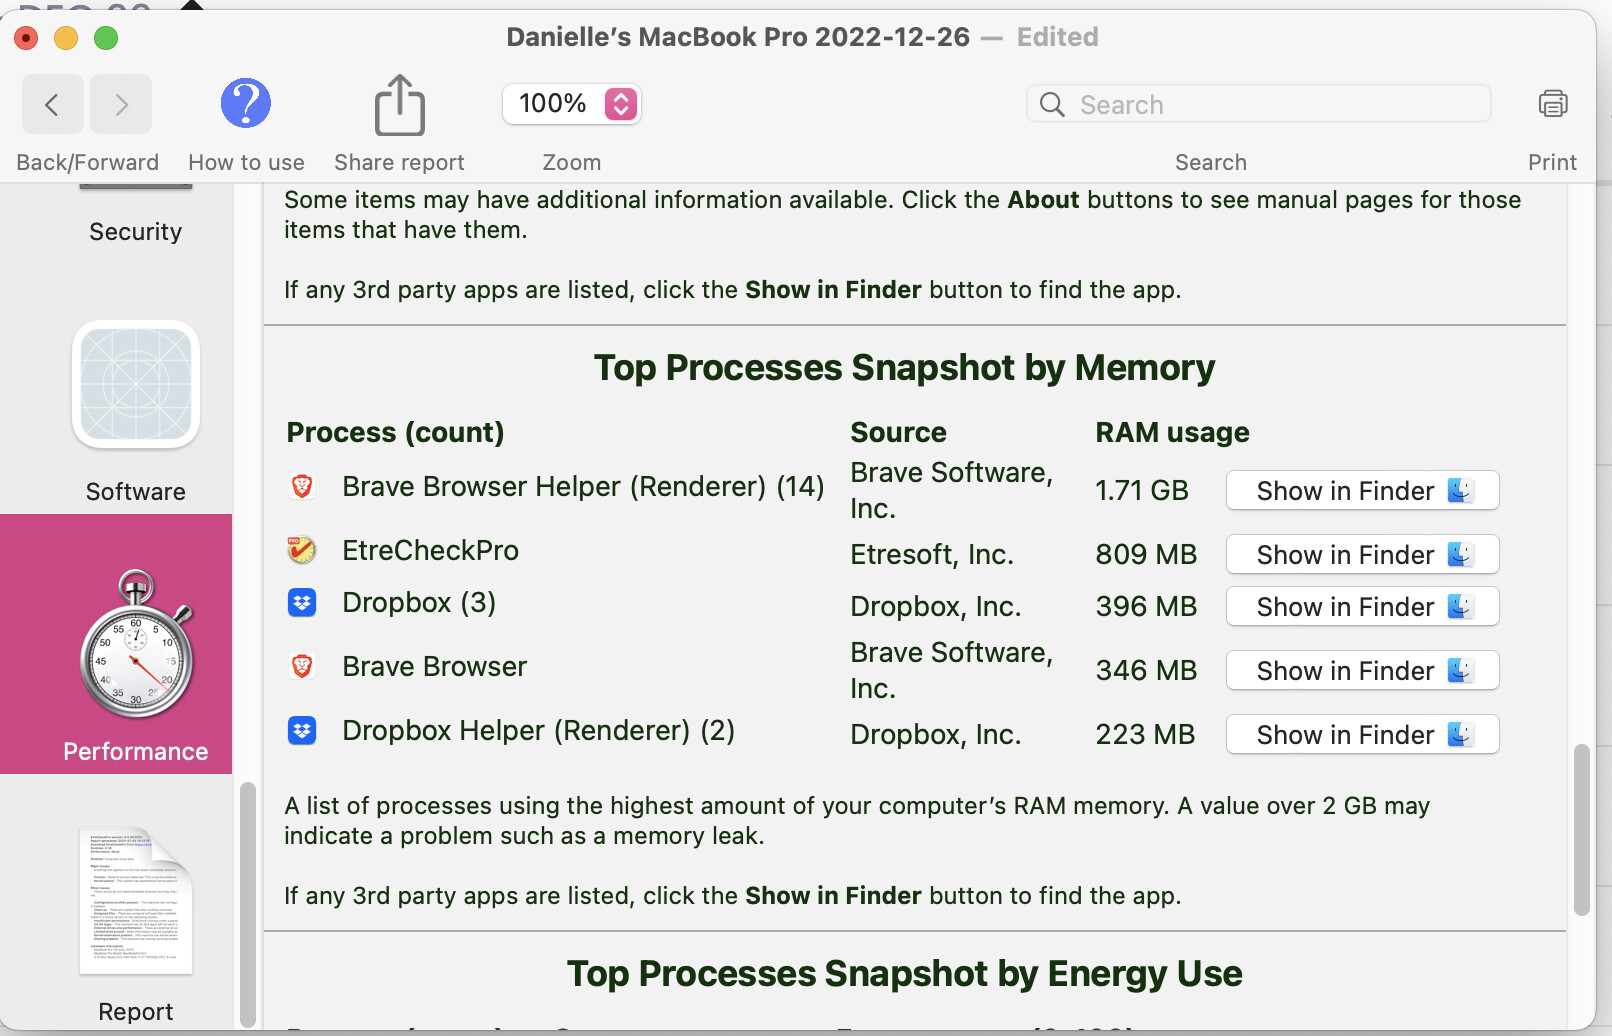
When I was given a snapshot of RAM Usage, I noticed that the browser helper was using a lot of memory. There was a notation that a value over 2 GB may indicate a problem such as a memory leak. The Brave browser helper (Renderer) is using 1.71 GB, which is less than 2, but still a lot compared to the others on the list. Image attached.
I’m just asking if this is normal or if this is something I need to fix somehow, and if so, how do I do that?
I ran the diagnostics twice. Images attached. Second time, RAM usage is 2.20 GB.
hi, @Kevin_cc ! thanks for the tip, however, i tried it and it didn’t work. i have istat menus installed as well and was able to replicate the issue on there as well. so two programs are picking up the 2 GB RAM usage of Brave Browser Helper (Renderer). any other thoughts?
@Kevin_cc or no, wait, i went in and turned off hardware acceleration the way by finding it in the user options. i didn’t open terminal. i don’t know what that is on my mac. if you can explain how to open terminal, i’ll type that code in. sorry, i forgot to be more clear!
Don’t disable Hardware acceleration, that’s a not smart advice to troubleshoot something related to memory and you will be using only CPU which means you computer will use more battery, will heat more. That test should be done last, not first, especially when you don’t even know which process is exactly the one using more memory or not, because seeing your screenshots it is 14 Brave Browser Helper (Renderer) being taken into account, not just 1.
So first, to troubleshoot anything like this, you need to use Brave’s internal task manager, you go to menu ☰ → More tools → Task Manager
That way you will know which process is using more memory.
Depending on your system, it is normal to use that amount of memory, especially for a Browser which has different process for services, extensions, tabs.
Also, your computer doesn’t get faster by not using memory, your memory is there to be used, the “memory not used is memory wasted” is accurate, unless it goes 90+% then you shouldn’t have problems like disk being used or something.
Yes, it could be leak in an extension, could also be just a heavy website by careless web developers, who only relay on JS and other heavy technologies for simple tasks, it could be a memory leak in a Brave’s service or something.
But of course, Brave’s task manager is the only way where you can really see which process is which and how much memory is being used by it and then take the better conclusion because you will see Youtube or some video website might be the reason, and then you understand it is not Brave but just a website. Never use OS task manager for that, I use a 3rd party resource monitor on windows and use Brave’s task manager to see the PID, and then filter the process correctly knowing what I am looking for.
hi @anon57438784 , thank you for that tip – i was able to get screen shots to break it down. great idea! thank you for your input, very much appreciated.
hi @Kevin_cc , thank you for that tip – i DO have extensions installed! i took a screen shot of my brave task manager before i removed them and after i removed them.
while doing so, and this is for both of you – i somehow found my way into mac’s diagnostic reporting and found the attached. please see an img first and the corresponding TXT file that goes with it has all the error code that is showing up. does any of this, what’s showing up in error here, have to do with the RAM memory issue – or is this separate?
Well, looking at the screenshots, it seems like normal usage to me, GPU will always consume that much memory to function when you watch videos and all that but the other services seem okay.
The other one that will always use is the main Browser process and 399MB is okay.
One thing, in my opinion, you should remove DuckDuckGo extension, it uses more memory than most processes, and it is useless because Brave already will do more than it, there is no real benefit about it and it will run on every page which means it might affect something. But it consumes ‘a lot’ of memory for what it will do anyway even a 0.1 CPU usage.
But usage seems okay, you should check when you see 2GB memory usage and see if it is like an extension or just a website being heavier than the usual.
But Chromium has many protections like sandboxing and isolation, which are useful but also made browsers create more processes and use more resources, especially to protect against spectre, so that’s why so many processes for subframes and dedicated/service workers and all that.
@dhm as @Emi stated it will better for you to disable such extension to see if the RAM usage decreases. Also it will be helpful to see what errors or messages you get when the RAM usage gets above 2.0 GB.
If the issue persist after disabling the extensions, let me know.
@anon57438784 – thank you so much! disabling the ddg extension has reduced the RAM usage! i also realized i can’t have more than 10+ tabs open for long periods (give or take) as that adds to it as well. i will permanently remove the ddg extension, and i found that in brave’s search engine settings, i could set ddg to be used as the default in the address bar – i’m set! thank you both, @anon57438784 and @Kevin_cc for helping me figure this out!
the whole reason i was pursuing this is because i was looking for any errors, anything at all, that could possibly cause my macbook to overheat. i have no idea if it could or couldn’t, but i thought i’d look into it. by the way, the issue regarding my macbook overheating must’ve been fixed with a software update some time in the last year because it’s no longer happening. i’d been using istat menus all this time to use their fan options to keep my macbook’s fans running (i’d already exchanged one macbook for another and it was still happening). it was after realizing the RAM usage problem wasn’t causing that, that i thought to check to see if my macbook was even still overheating. i just assumed it was. so i paused istat menus and found all on my macbook is running as it should, i think.
…except for the google updater login issues i’m having now… omg! lol. do you have a discussion on this here on brave for possible solutions? just thought i’d ask.
anyway, THANKS AGAIN TO YOU BOTH! have a great new year!
@anon57438784 and / or @Kevin_cc – do you know how to highlight text? i’m supposed to highlight the solution, only i can’t figure out how to. thanks so much in advance.