DiagnosticReports
Please start up your Mac’s Console.app – it is located here:
/Applications/Utilities/Console.app
There is a panel in the left-hand side of the Console window. A portion of the panel looks like:

If you do not see that, then select “Show Sources” in the Console menu bar > View menu.
You may have to then, toggle the ~/Library/Logs for it to expand and reveal the DiagnosticReports.
You are looking for “Brave Browser . . .crash” reports. The beginning lines of such a report, will look similar to:

Within a couple dozen lines further down, you would see lines something like:

The following items are important:
- “Crashed Thread” number
- “Exception Type”
- “Exception Codes”
Further down in such a crash report, you will find the Thread Number. Its line and its series of lines, report at least something, as to what and / or why, there was a crash.
If you find such information, only the lines illustrated and discussed here, are helpful.
Do not fret, if you do not find such crash reports.
–
Please start up your Mac’s Activity Monitor, and arrange its window to appear like the following:

Do Not display a screenshot of what your Activity Monitor shows. Please, just count all the Brave Browser processes that your Activity Monitor reports during your typical computer operations surrounding a problem download. Please report back here, with the count.
–
Please start up your Brave Browser > Task Manager. You can find the command, by looking at the Brave Browser menu bar and its Help menu, wherein you can type: Task Manager
Arrange its window to appear like the following:
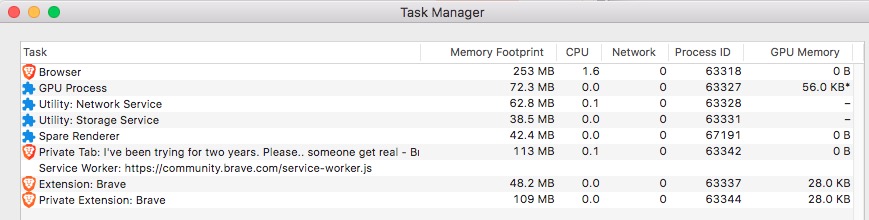
Do Not display a screenshot of what your Brave Browser > Task Manager window shows. Please, just count all the processes reported during your typical computer operations surrounding a problem download. Please report back here, with the count.
As a matter of interest, you will find some of the Process ID (PID) numbers of the Activity Monitor processes and the Task Manager processes, match.
–
Crash Report References:
[Apple - Developer:] Analyzing a Crash Report [a general overview]
“https://developer.apple.com/documentation/xcode/analyzing-a-crash-report”
[Apple - Developer:] Examining the Fields in a Crash Report:
“Understand the structure of a crash report and the information each field contains”
“Exception Information”
“Every crash report contains exception information. This information section tells you how the process terminated, but it may not fully explain why the app terminated. This information is important, but is often overlooked.”
“https://developer.apple.com/documentation/xcode/examining-the-fields-in-a-crash-report”
[Apple - Developer:] Understanding the Exception Types in a Crash Report:
“Learn what the exception type tells you about why your app crashed”
https://developer.apple.com/documentation/xcode/understanding-the-exception-types-in-a-crash-report
[Apple - Developer:] Identifying the Cause of Common Crashes
“Find patterns in crash reports that identify common problems, and investigate the issue based on the pattern.”
“https://developer.apple.com/documentation/xcode/identifying-the-cause-of-common-crashes”
[Apple - Developer:] Investigating Memory Access Crashes
“Identify crashes that arise from memory access issues, and investigate the cause of the crash.”
“https://developer.apple.com/documentation/xcode/investigating-memory-access-crashes”
Crash Reports: How To Use Them To Troubleshoot Why Your Mac Crashed
–